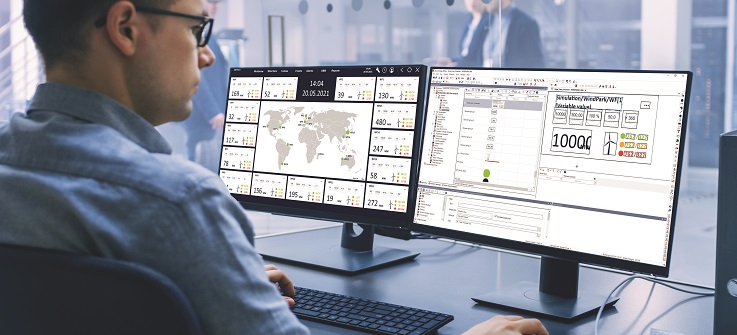
Remember, in our previous article, you created a “Motor” structure data type with the “Temperature”, “Speed”, and “State” structure elements, as well as appropriate variables with the names “Motor_Band1” (...2, ...3). You can now continue working with this.
Last time, you learned how to reuse symbols by replacing the variables using linking rules, among other things. We will now explore another option for this using hierarchical names.
How to use hierarchical names with symbols
Create a new symbol with labeling and value displays for temperature and speed. However, with the individual elements, do not link the variables directly. Instead, just enter “Temperature” and “Speed”. In the symbol editor, you will now see the element with a blue cross and without a value preview, which is OK for now.
Next, drag the symbol onto a screen. The familiar dialog for replacing the links will appear. However, do not enter any rules here. Instead, check the “Hierarchical names” checkbox and press “OK” to close the dialog. Then change the element ID to “Motor_Band1” in the property window under the “General” node. The variables will be correctly linked automatically. They therefore combine the element ID of the symbol on the screen with the name given manually beforehand using a dot (“.”) to generate the actual variable name: for example, “Motor_Band1. Temperature”.
How to replace links in the screen switch function
As with the symbols, the screens also give you the option of replacing links. In the screen switch function, you will be able to see the “Replace links” and “Replace indices” tabs, as long as there are replaceable elements on the screen. With both of these methods, you can replace variables (including interlocks used on the screen), functions and Automatic Line Coloring (ALC) aliases on the screen. As a result, you can reuse the same screen as often as you want instead of having to duplicate it again and again.
With a single click
As with the symbols, you can enter a source and a target for the linking rule in both input fields. When you click on “Apply”, this will be applied directly, unlike with the symbols. In the list below the input fields, you will immediately see the result of the replacement. If individual entries were not recorded by the replacement rule or if they are meant to be edited manually, select the entry and click on “Variable/function”. When you double-click, you will also be taken directly to the entry. In addition, you can also navigate within the target column using the cursor buttons to enter the target directly.
How to replace indices in the screen switch function
You can also replace content in screens very flexibly using the “Replace indices” tab. Here you can link up to 99 variables and use them in several replacement rules. By doing so, you can amend the configured screen switch function in zenon Service Engine as you wish using the current system status.
If you have lots of these detail screens, you don‘t need to write the set value to countless scripts and configure screen switch functions. Instead, you can simply use the “Parameter for substitution” property, which is available with the button, combined element and combo/listbox screen elements. You can use the value for this parameter in the “Replace indices” tab with the {PARAM} keyword, either on its own or in combination with other links.
TIP: zenon makes it easier to work with large numbers of similar elements. However, for this, the elements need to be named consistently (variables, functions, etc.). We therefore recommend defining a company-wide naming structure in advance, particularly if several people are working on the same project.
How to use zenon Faceplates efficiently
To date, it has been assumed in the example that only current variable values should be displayed. But what if you want to give the operator at the machine more information? For example, the temperature trend since switch-on, the Alarm Message List from this period, or simply a data sheet for the motor? Then, all you need to do is use the Faceplate screen type. The Faceplate allows you to display several screens of different types on the same screen and configure them collectively using a screen switch function.
The Faceplate currently supports the following screen types:
- Alarm Message List (AML)
- AML filter
- Equipment model
- Chronological Event List (CEL)
- CEL filter
- Extended Trend (ETM)
- HTML – Report Generator
Report Viewer
- Default filter
- Time/Lot/Shift filter
How to work with Faceplates
First, generate the individual screens in the correct size. Then create a screen of the Faceplate type, in which the individual screens (e.g. AML, ETM, HTML) are linked in screen containers.
Next, create a new screen switch for this screen and configure it. In the upper part of the dialogue, the filters that have been used are displayed (default: none). In the lower part, the screen containers that have been created and the linked screen types are listed.
To start with, click on the “New” button below the filter list. In the selection dialogue, all filter types that match the screen types you have used are displayed. In this case, you need the “Time” filter under “General filters” and the “Alarm Message List (general)”, “Extended Trend (general)”, and “HTML (general)” filters under “Screen type-specific filters”. Then link the filters you have just created with the individual screen containers. In the selection dialogue, you will then only be offered the suitable filters, all of which you must apply and then configure appropriately. In “Alarm Message List (general) 1”, enter a filter at “Variable name” “Motor_Band1*”. In “Extended Trend (general) 1”, link the variables and in “HTML (general) 1”, add a link to the motor data sheet.
Example: comparing timeframes
As you can see, the Faceplate is very flexible when it comes to combining different screen types. For example, if you want to compare a parameter in two timeframes and give the user the option of changing the timeframes in zenon Service Engine, you can also implement this. To do so, you need two “Extended Trend” screens and two “Time/Lot/Shift filter” screens in the screen containers. In the screen switch, create two separate time filters, link them and configure the filters of both screen containers for the time filter so that they each work on an ETM screen.
All symbols follow your command
For the example, create a new reaction matrix of the “Numeric” type and link it with the three variables “Motor_Band1.Temperature”, (...2...), and (...3...). In the configuration dialogue, create a new condition and set “Greater 80” under “Value”. In the “AML/CEL” area, check the “In Alarm Message List” checkbox. Under “Additional attributes”, set “Orange” as the limit value colour. In the motor symbol, link the variable “Motor_ Band1.Temperature” to the icon in the “Fill” – “Fill colour dynamic” node. This variable is automatically recorded by the replacement rule defined at the start. From now on, all motor symbols will be filled in when you reach the relevant limit value.
How to define and link limit values
In zenon, limit values can respond to changes to the variable values, give them a meaning and lead to actions.
Suppose that you want to generate an alarm at temperatures greater than 80 degrees, indicate this to the user and fill a screen element orange.
There are several options for defining limit values for variables in zenon:
- Directly at the variable.
- At the data type (see part 2 of the series).
- Centrally using a reaction matrix.
The reaction matrix offers some advantages compared to the other two ways:
- It can be used for any number of variables, as well as different data types.
- It is available for Boolean, numerical and string variables.
- It offers analysis options, such as value ranges, threshold values, status analysis, status ranking, etc.
- It forms the basis of the Gantt display in the Extended Trend (ETM).
More fascinating insights
In this part of the series, you have learned how to use advanced options when replacing links and indices, bring data into context with the help of zenon Faceplates and give variable changes a meaning in a simple and central way, thereby triggering an action. In the next part of the series, you will discover the steps required to implement a modern visualization.